
Source-linked, always
Each item links back to its documentation.
Research & Responsible Technology
We built Congo Evidence Observatory to bring together source-linked documentation and analysis of conflict incidents, actors, relationships, locations, and timelines in the DRC — for journalists, students, researchers, policymakers, and community advocates.
Visit congoevidence.org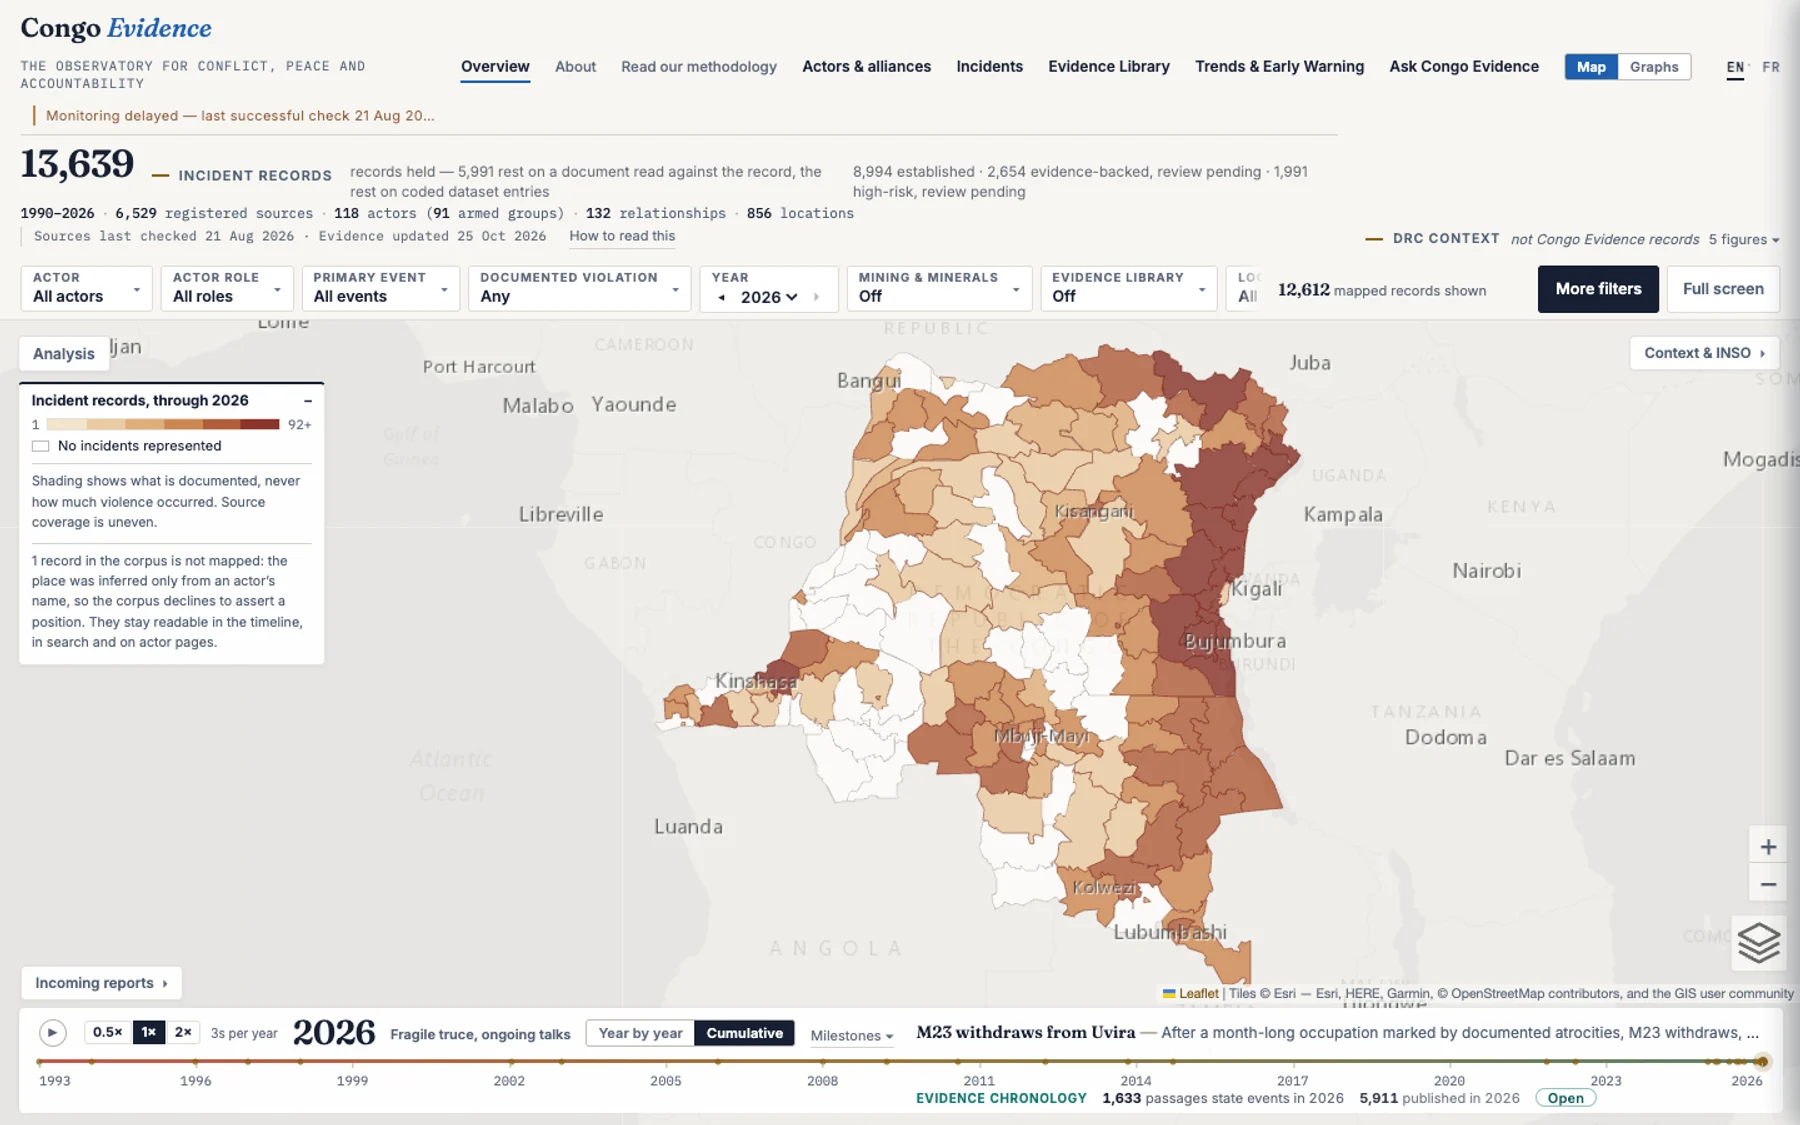
We built Congo Evidence Observatory to bring together source-linked conflict records, interactive maps, timelines, and analytical tools that help people explore and understand the dynamics of conflict in the Democratic Republic of Congo. Every record links back to its documentation, and the platform follows its sources’ own careful standards: it complements, rather than replaces, lived community knowledge and specialized protection and humanitarian actors.
Beyond the incident map, we look at how documented patterns change over time to support better questions about shifting conditions and where closer attention may be needed. It’s a tool for responsible analysis, not a prediction of specific attacks — and it keeps documented events, source coverage, and analytical interpretation clearly distinct.
Each item links back to its documentation.
Built for journalists, students, researchers, policymakers, and community advocates.
Our map updates as we review and add new documentation.
Figures above reflect our own program reporting, and each one notes what it measures.